Overview
The Step Plot node is a statistical-plot node in a Weave Workflow that visualizes data which changes abruptly at specific points. A step plot, also known as a step chart or stair plot, is a type of data visualization that is particularly useful for showing data that changes abruptly at specific points. It is similar to a line plot but emphasizes the discrete changes in the data values. The node sits under the Statistics tab, distinct from the transformation nodes, and produces a visual output rather than a transformed table.
Like the Line Plot and Scatter Plot nodes it is configured with X and Y axis dropdowns; it adds a Position of Steps dropdown (Pre, Mid, Post) that controls where each step transition falls.
Note: “Workflow” is the in-UI term for what some Weave documentation calls a pipeline. This reference uses “Workflow.”


When to use it
- Showing values that hold constant and then change abruptly, such as rates or states over time.
- Emphasizing discrete transitions rather than smooth change between points.
- Plotting a single X-versus-Y relationship where the step shape communicates the data better than a line.
Configuration
| Field | Description |
| X | Dropdown that selects the column for the horizontal (X) axis. |
| Y | Dropdown that selects the column for the vertical (Y) axis. |
| Position of Steps | Sets where the step transition occurs: Pre, Mid, or Post. |
Position of Steps options
| Option | Description |
| Pre | The value steps before the interval between points. |
| Mid | The value steps at the midpoint of the interval between points. |
| Post | The value steps after the interval between points. |
Key behaviors
Statistical-plot node. Step Plot is found under the Statistics tab, separate from the transformation nodes, and outputs a visualization rather than a modified data table.
Axis-dropdown configuration. Configuration uses X and Y single-column dropdowns, the same pattern as the Line Plot and Scatter Plot nodes, plus the Position of Steps control.
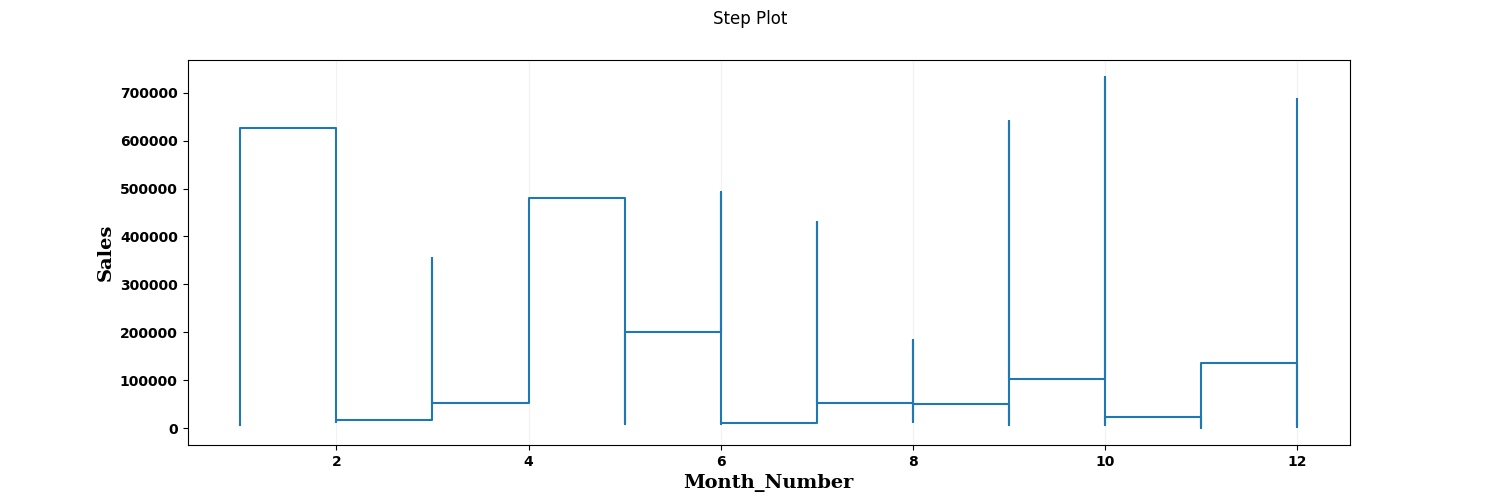
Stepped connection. Points are joined by horizontal segments and vertical jumps rather than diagonal lines, so changes in the Y value read as abrupt transitions.