Overview
The Descriptive Statistics node summarizes the columns of a table with descriptive statistics. For each selected variable, one or more statistics can be computed, and the result is presented as a table with one column per variable-and-statistic combination.
The node sits under the Statistics tab and, unlike the statistical-plot nodes, produces a tabular summary rather than a chart. Configuration has three parts: a Target Variable, the variables to summarize, and a per-variable statistic selection.
Note: “Workflow” is the in-UI term for what some Weave documentation calls a pipeline. This reference uses “Workflow.”


When to use it
- Profiling columns with summary statistics before deeper analysis.
- Checking data quality through counts of nulls, negatives, and outliers.
- Comparing the distribution shape of columns via percentiles.
- Producing a compact statistics table for selected variables.
Configuration components
| Component | Description |
| Select Target Variable | Dropdown that selects the target variable of the dataset. |
| Descriptive Statistics (Select) | Opens the popup listing the columns to summarize. |
| Variable checkboxes | Choose the variables to compute statistics for. |
| Select Aggregation Function | Per-variable dropdown to choose one or more statistics; selections appear as removable tags. |
| Apply | Commits the variable and statistic selections. |
Available statistics
| Statistic | Description |
| Mean | The average of the values. |
| Count | The number of values. |
| Standard Deviation | The standard deviation of the values. |
| Kurtosis | The kurtosis of the distribution. |
| Skewness | The skew (asymmetry) of the distribution. |
| 25th Percentile | The first-quartile value. |
| 50th Percentile | The median value. |
| 75th Percentile | The third-quartile value. |
| Minimum | The smallest value. |
| Maximum | The largest value. |
| Data Type | The data type of the column. |
| Negative Value count | The number of negative values. |
| Null Value Count | The number of null values. |
| Outlier Count | The number of outlier values. |
Output
| Output element | Description |
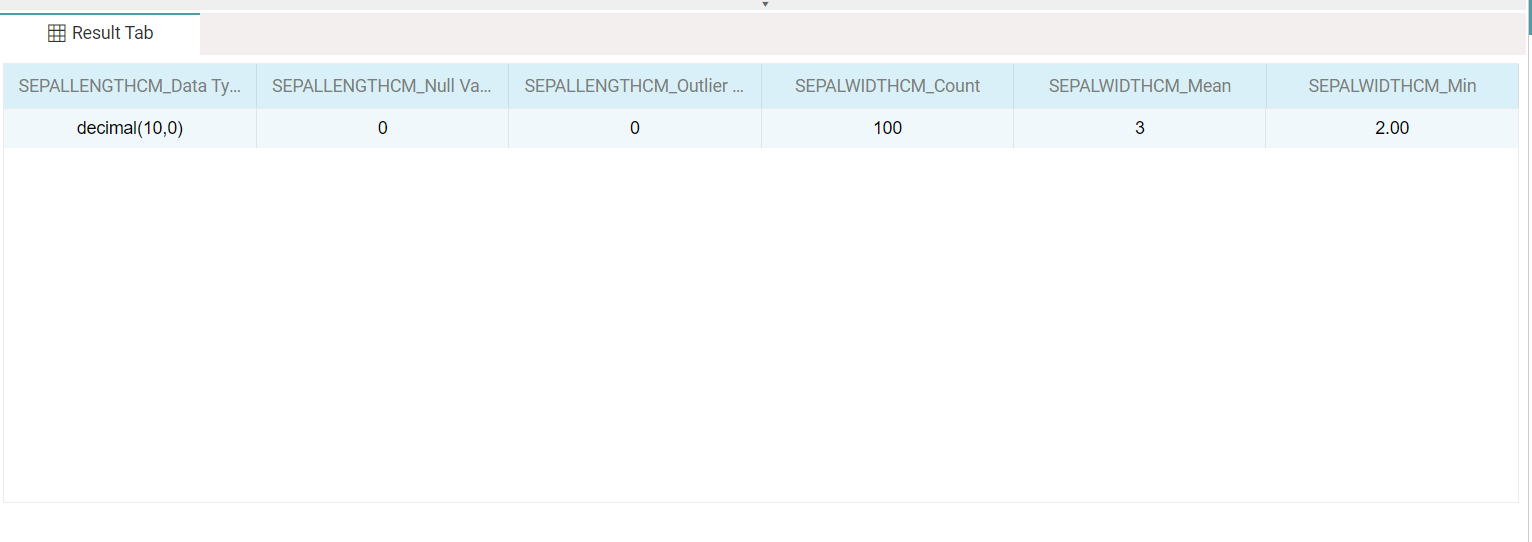
| Result columns | One column per variable-and-statistic pair, named variable_statistic (e.g. SEPALWIDTHCM_Mean). |
| Result row | The computed values for the selected statistics. |
Key behaviors
Tabular output. Unlike the statistical-plot nodes under the Statistics tab, Descriptive Statistics returns a summary table rather than a chart.
Per-variable statistics. Each selected variable carries its own set of statistics, so different columns can be summarized differently in one node.
Column naming. Each result column is named by combining the variable and the statistic, so the table can hold many statistics across many variables without ambiguity.