Overview
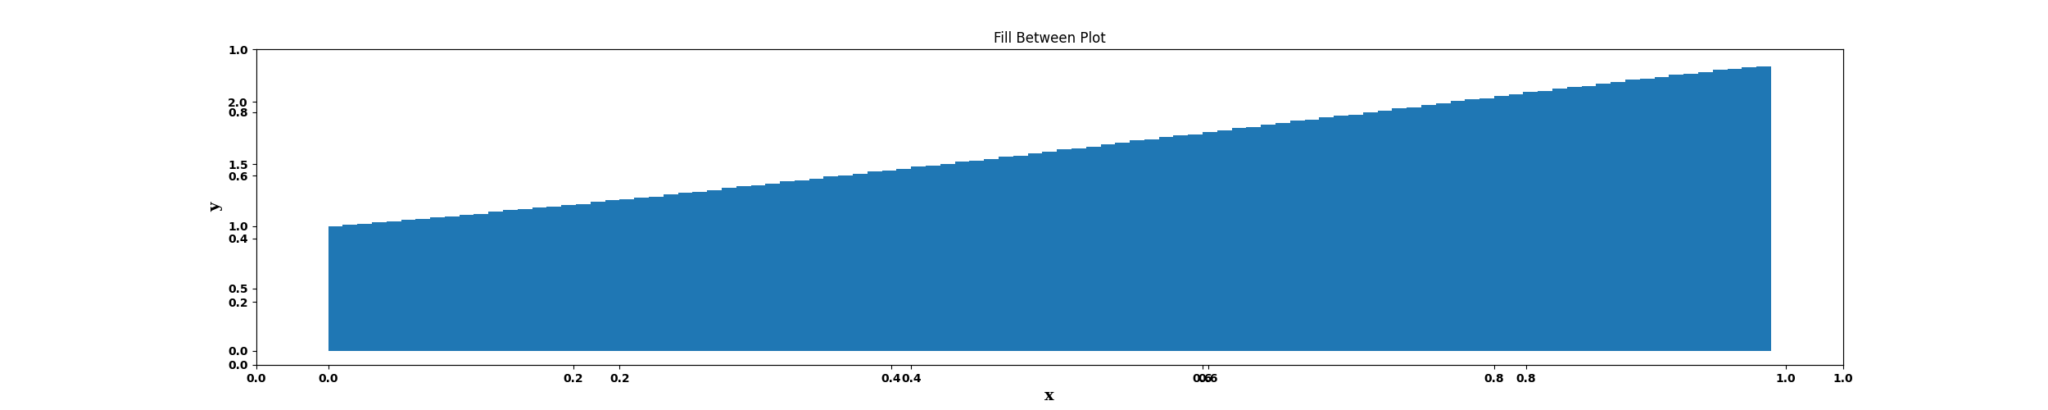
The Fill Between node is a statistical-plot node in a Weave Workflow that draws a step plot and shades the area beneath the stepped curve. The shading emphasizes ranges or relationships in the data. The node sits under the Statistics tab, distinct from the transformation nodes, and produces a visual output rather than a transformed table.
Configuration uses X and Y column dropdowns plus a Position of Steps control; more than one X/Y pair can be added to plot multiple series.
Note: “Workflow” is the in-UI term for what some Weave documentation calls a pipeline. This reference uses “Workflow.”


When to use it
- Emphasizing the area under a stepped series to highlight magnitude or range.
- Visually comparing the filled regions of more than one X/Y series.
- Communicating where values hold and change while drawing attention to the enclosed area.
Configuration
| Field | Description |
| X | Dropdown that selects the column for the horizontal (X) axis of a series. |
| Y | Dropdown that selects the column for the vertical (Y) axis of a series. |
| Additional X/Y pairs | More than one X/Y pair can be added, each plotting another series. |
| Position of Steps | Sets the place (before, middle, or after) where the step changes with respect to the x-value: Pre, Mid, or Post. |
Position of Steps options
| Option | Description |
| Pre | The step changes before the x-value. |
| Mid | The step changes at the middle relative to the x-value. |
| Post | The step changes after the x-value. |
Key behaviors
Statistical-plot node. Fill Between is found under the Statistics tab, separate from the transformation nodes, and outputs a visualization rather than a modified data table.
Step plot with shading. The node renders the selected columns as a step plot and shades the enclosed area, combining the Step Plot node’s stepped connection with an area fill.
Multiple series. More than one X/Y pair can be configured, so several series can be plotted in one node.