Overview
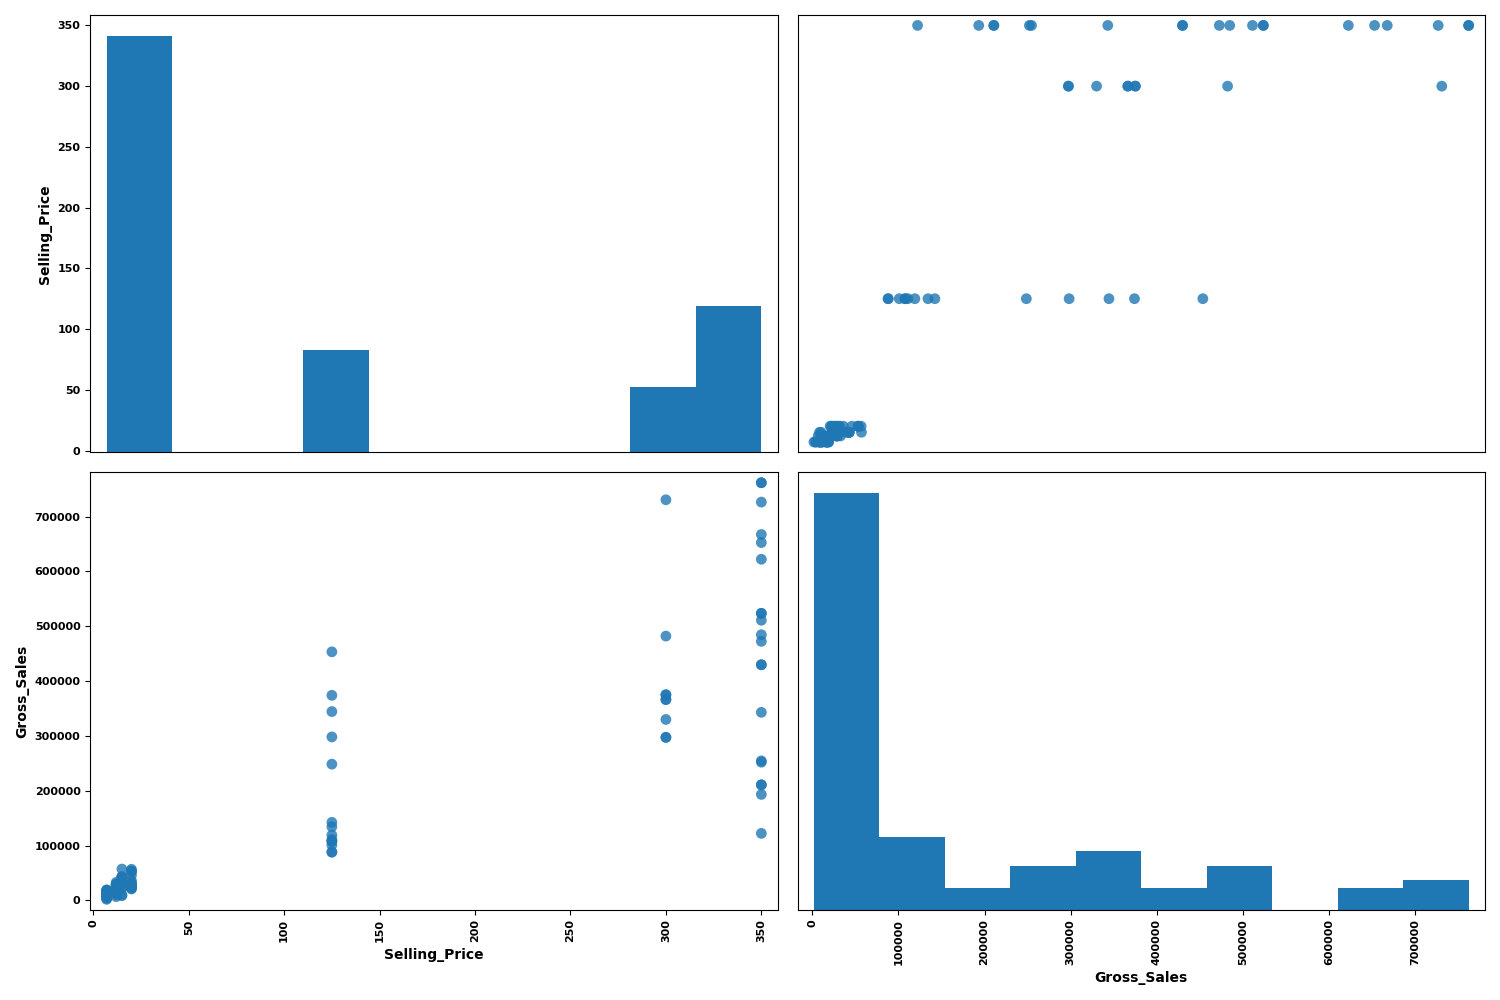
The Pair Wise node is a statistical-plot node in a Weave Workflow that renders a pair plot of the selected columns. The pair plot is a grid that plots every selected column against every other, with each cell showing the relationship between a pair of columns.
The node sits under the Statistics tab, distinct from the transformation nodes, and produces a visual output rather than a transformed table. The node applies to the columns selected in the Pair Wise popup, pairing numerical columns against one another.
Note: “Workflow” is the in-UI term for what some Weave documentation calls a pipeline. This reference uses “Workflow.”


When to use it
- Scanning relationships between several numerical columns at once.
- Spotting linear or clustered patterns between column pairs visually.
- Reviewing each column’s own distribution alongside its pairwise scatter plots.
- Exploring data before choosing columns for deeper analysis.
Grid structure
| Cell | Description |
| Off-diagonal cells | Scatter plots of one selected column (x-axis) against another (y-axis). |
| Diagonal cells | The distribution of a single column plotted against itself. |
| Axis labels | Each row and column of the grid is labeled with its field name. |
Configuration
| Step | Description |
| Select | Opens the Pair Wise popup listing the columns in the upstream data. |
| Select All | Selects every column in the popup. |
| Column checkboxes | Choose the columns to include in the pair plot. |
| Apply | Commits the column selection. |
Key behaviors
Statistical-plot node. Pair Wise is found under the Statistics tab, separate from the transformation nodes, and outputs a visualization rather than a modified data table.
All-pairs grid. The node plots each selected column against every other, so the grid has one row and one column per field. Cell count grows with the square of the number of columns.
Scatter plus distribution. Off-diagonal cells show pairwise scatter plots while diagonal cells show each column’s own distribution, combining relationship and distribution views in one grid.